

Managing cloud costs effectively is one of the biggest challenges facing organizations today—studies show that 30% of cloud spend is wasted due to poor visibility and planning. If you’re trying to understand your AWS bill or forecast future expenses, you’ve likely encountered two critical tools: AWS Pricing Calculator and AWS Cost Explorer. While both are essential for cloud financial management, they serve fundamentally different purposes, and confusing them can lead to budget overruns and missed optimization opportunities.
The AWS Pricing Calculator vs Cost Explorer decision isn’t about choosing one over the other—it’s about understanding when to use each tool in your FinOps workflow. The Pricing Calculator helps you estimate costs before deploying resources, while Cost Explorer analyzes your actual spending after resources are running. This comprehensive guide breaks down both tools, compares their capabilities, and provides a clear framework for leveraging each one to optimize your AWS investment. Whether you’re a CTO planning a cloud migration, a developer architecting a new application, or a FinOps practitioner managing enterprise-scale infrastructure, you’ll discover exactly how these tools complement each other in building cost-effective AWS solutions.
What is AWS Pricing Calculator?
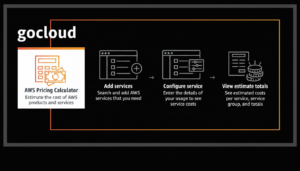
AWS Pricing Calculator is a free, web-based planning tool that helps you estimate the cost of AWS services before you deploy them. Think of it as your pre-purchase cost modeling sandbox where you can experiment with different architectures, configurations, and service combinations to understand their financial implications.
Key Features of AWS Pricing Calculator
Service-by-service cost modeling allows you to configure specific AWS services with precise specifications. You can select an EC2 instance type (t3.medium, m5.large, etc.), define usage patterns (hours per month, data transfer volumes), choose pricing models (On-Demand, Reserved Instances, Savings Plans), and see itemized cost breakdowns.
Architecture estimation enables building complex multi-service environments. Create an estimate that includes EC2 compute, RDS databases, S3 storage, Lambda functions, and VPC networking—all within a single calculation. This holistic view helps you understand total cost of ownership (TCO) before committing resources.
Location-based pricing automatically adjusts costs based on AWS region selection. Since pricing varies significantly between regions (US East is typically cheapest, Asia Pacific and South America cost more), the calculator ensures accurate estimates for your target deployment location.
Savings Plans and Reserved Instance modeling lets you compare On-Demand pricing against commitment-based discounts. Input your baseline usage, and the calculator shows potential savings from 1-year or 3-year Reserved Instances (up to 72% discount) or Compute/EC2 Instance Savings Plans (up to 66% discount).
Export and sharing capabilities allow you to save estimates as PDF reports or shareable links. This facilitates collaboration with stakeholders, budget approvals, and documentation for future reference. You can also export to CSV for custom analysis in spreadsheets.
Group organization helps structure complex estimates by creating service groups (Development, Staging, Production) within a single calculation. This logical organization mirrors your actual infrastructure and enables clearer cost attribution.
Use Cases for AWS Pricing Calculator
Pre-migration planning is the most common use case. Organizations moving from on-premises infrastructure or other cloud providers use the calculator to model their entire AWS architecture and compare costs against current spending. This creates a business case for cloud migration with concrete numbers.
Architecture comparison helps teams evaluate different design approaches. Compare serverless Lambda functions vs. EC2 instances, analyze RDS vs. self-managed databases on EC2, or evaluate multiple EC2 instance families for the same workload. The calculator reveals which approach delivers better price-performance.
Budget forecasting for new projects gives finance teams the data they need for annual planning. When launching a new product or application, the calculator provides monthly and annual cost projections based on expected usage patterns and growth trajectories.
Client proposals and quotes enable consulting firms and solution architects to provide accurate cost estimates to clients. Build a detailed estimate showing exactly what AWS infrastructure will cost, broken down by service and usage pattern.
Proof-of-concept planning allows teams to budget for POCs and MVP development. Understanding costs upfront prevents budget surprises and ensures adequate funding for experimentation phases.
What is AWS Cost Explorer?
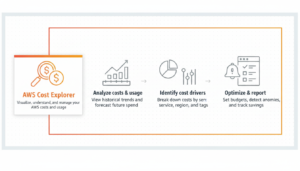
AWS Cost Explorer is a visualization and analysis tool for examining your actual AWS spending patterns, trends, and resource utilization. Unlike the forward-looking Pricing Calculator, Cost Explorer is retrospective—it helps you understand what you’ve already spent and identify optimization opportunities.
Key Features of AWS Cost Explorer
Historical spend analysis provides up to 13 months of cost and usage data with daily or monthly granularity. View your spending trends over time, identify sudden spikes, and compare costs across different periods (month-over-month, year-over-year).
Granular filtering and grouping enables multi-dimensional cost analysis. Filter by AWS service (EC2, S3, RDS), linked account (in AWS Organizations), region, instance type, usage type, or custom tags. Group costs by any dimension to see spending breakdowns from different perspectives.
Forecasting capabilities project future costs based on historical patterns using machine learning. Cost Explorer analyzes your last 3-6 months of usage and predicts next month’s spend with confidence intervals, helping you anticipate budget needs.
Cost allocation tags allow tracking costs by business unit, project, environment, or customer. By tagging resources consistently (Project: mobile-app, Environment: production, Team: engineering), you can attribute costs to specific initiatives and enable chargeback/showback models.
Reserved Instance and Savings Plans recommendations automatically identify optimization opportunities. Cost Explorer analyzes your On-Demand usage patterns and recommends specific RI or Savings Plan commitments that would reduce costs, showing projected savings.
Rightsizing recommendations detect over-provisioned resources. By examining CloudWatch metrics, Cost Explorer identifies EC2 instances running at low utilization and suggests downsizing to smaller instance types or switching to different instance families.
Cost anomaly detection uses machine learning to identify unusual spending patterns. Get alerts when costs deviate significantly from expected baselines—catching misconfigured auto-scaling, forgotten resources, or unexpected traffic spikes before they devastate budgets.
Use Cases for AWS Cost Explorer
Monthly cost reporting gives finance teams accurate spending data for reconciliation and reporting. Generate reports showing actual costs by department, project, or business unit for chargeback to internal stakeholders.
Cost optimization identification reveals where money is being wasted. Filter to services with highest spend, analyze usage patterns, and identify resources running 24/7 that could be scheduled, oversized instances that should be downsized, or data transfer costs that could be reduced.
Budget variance analysis helps explain why actual spending differs from forecasts. When your AWS bill exceeds expectations, Cost Explorer’s filtering capabilities let you drill down to identify which services, regions, or accounts drove the overage.
Savings Plan and Reserved Instance coverage tracking monitors how effectively your commitments are being utilized. View utilization rates (percentage of commitment actually used) and coverage rates (percentage of usage covered by commitments vs. On-Demand) to ensure you’re maximizing value from purchased commitments.
Trend analysis for capacity planning shows growth trajectories. By examining 6-12 month spending trends on compute, storage, and data transfer, you can project infrastructure scaling needs and budget for future growth.
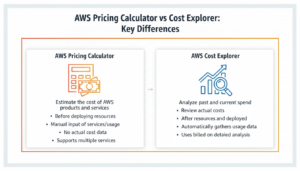
AWS Pricing Calculator vs Cost Explorer: Key Differences
Understanding the fundamental distinctions between these tools prevents misuse and ensures you leverage each one appropriately in your FinOps workflow.
Timing: Prospective vs Retrospective Analysis
AWS Pricing Calculator operates before deployment. It’s your planning tool for estimating costs of resources you haven’t yet launched. Use it during architecture design, migration planning, and budgeting phases when you need to predict expenses for proposed infrastructure.
Cost Explorer operates after deployment. It analyzes actual spending on resources currently running or recently terminated. Use it for ongoing cost management, optimization, and understanding historical patterns in your existing AWS environment.
Analogy: Pricing Calculator is like a home price estimator before buying a house; Cost Explorer is like your actual mortgage statement and utility bills after moving in.
Data Source: Estimates vs Actuals
Pricing Calculator uses AWS’s official rate cards and your input assumptions. You manually specify usage patterns (hours per month, GB stored, requests per second), and it calculates theoretical costs based on published pricing. Accuracy depends entirely on how well your inputs match reality.
Cost Explorer uses your actual billing data from AWS Cost and Usage Reports. It reflects real resource consumption, including burst usage, traffic spikes, and services you forgot about. The data is authoritative—it’s exactly what you were billed.
Implication: Pricing Calculator estimates can be wrong if your usage assumptions are incorrect. Cost Explorer tells you the truth about what actually happened but can’t predict future costs without historical patterns.
Scope: Proposed Architecture vs Entire AWS Account
Pricing Calculator focuses on specific estimates you manually create. You model individual projects, applications, or migration scenarios. It doesn’t have visibility into your existing AWS infrastructure unless you manually replicate it.
Cost Explorer encompasses your entire AWS account (or organization). It automatically captures costs from all services, all regions, all resources—everything generating charges. You don’t configure it; AWS populates it with comprehensive billing data.
Use case example: Use Pricing Calculator to estimate a new microservices architecture. Use Cost Explorer to understand your current monolith’s actual costs. Compare the two to build a migration business case.
Granularity: Service Configuration vs Spending Patterns
Pricing Calculator operates at the resource configuration level. Specify exact instance types (m5.2xlarge), storage volumes (100 GB gp3), data transfer amounts (5 TB/month), and usage patterns (16 hours/day). This granularity enables precise modeling but requires detailed input.
Cost Explorer operates at the cost dimension level. View spending by service, region, or tag, but you can’t drill down to individual resource configurations from months ago. You see “EC2 in us-east-1 cost $10,000” but not which specific instances drove that cost unless you implement detailed tagging.
Practical difference: Pricing Calculator helps you decide “should we use r5.xlarge or r6i.xlarge for our database?” Cost Explorer helps you answer “which team’s EC2 instances consumed the most budget last month?”
Accuracy: Theoretical vs Historical
Pricing Calculator accuracy depends on estimate quality. If you underestimate data transfer by 10×, your cost projection will be 10× wrong for that component. Common mistakes include forgetting data transfer costs, underestimating storage growth, and misjudging peak usage requirements.
Cost Explorer accuracy is guaranteed—it’s your actual bill. However, its forecasting feature is probabilistic, providing confidence intervals (P50, P80 predictions) rather than certainties. Forecasts assume future usage patterns resemble historical ones, which may not hold during rapid growth or infrastructure changes.
Integration and Automation
Pricing Calculator is manual with limited automation. While you can save and reuse estimates, there’s no API for programmatic access or integration with CI/CD pipelines. Each estimate requires human interaction through the web interface.
Cost Explorer offers API access via AWS SDK, enabling automated reporting, alerting, and integration with third-party FinOps platforms. You can programmatically query cost data, generate custom reports, and trigger actions based on spending thresholds.
Advanced use: DevOps teams can call the Cost Explorer API in CI/CD pipelines to compare estimated vs. actual costs post-deployment, automatically flagging infrastructure that exceeds budgeted amounts.
Side-by-Side Comparison Table
| Feature | AWS Pricing Calculator | AWS Cost Explorer |
| Primary Purpose | Estimate costs before deployment | Analyze actual spending after deployment |
| Data Source | AWS rate cards + user inputs | Actual billing data from Cost & Usage Reports |
| Time Orientation | Forward-looking (future costs) | Backward-looking (historical costs) + forecasting |
| Scope | Specific estimates you create | Entire AWS account/organization |
| Cost | Free | Free (basic), Advanced features may require Reserved Instance/Savings Plans purchase |
| Historical Data | None (estimates only) | Up to 13 months |
| Forecasting | Manual scenario modeling | ML-based predictions (3-6 month projections) |
| Granularity | Service configuration level | Cost dimension level (service, tag, region) |
| Automation | Limited (manual estimates) | API access for programmatic queries |
| Recommendations | None (you build estimates) | RI/SP recommendations, rightsizing suggestions |
| Export Options | PDF, CSV, shareable link | CSV, API, integration with QuickSight |
| Use Case | Planning, budgeting, proposals | Monitoring, optimization, reporting |
| Best For | Pre-migration, architecture design | Post-deployment cost management |
When to Use AWS Pricing Calculator
Choose the Pricing Calculator when you need to estimate costs before committing resources or when modeling hypothetical scenarios.
Pre-cloud migration planning: Organizations moving from on-premises data centers or other cloud providers need concrete cost projections to build a business case. Model your target AWS architecture completely—compute instances matching your current server specs, storage volumes for your data, database services, networking costs. Compare the total against current infrastructure spend to demonstrate ROI.
New project budgeting: When launching a new application or service, finance teams require budget allocation before development begins. Build a detailed estimate showing development, staging, and production environments. Include compute, storage, database, and network costs. Project monthly and annual expenses for budget approval processes.
Architecture evaluation: Compare multiple design approaches before implementation. Model serverless Lambda vs. containerized ECS vs. traditional EC2 deployments for the same workload. Evaluate cost differences between RDS managed databases and self-hosted databases on EC2. The calculator reveals which architecture delivers the best cost-performance balance.
Client proposals: Consulting firms and solution architects need accurate quotes for client engagements. Build estimates showing infrastructure costs for proposed solutions, broken down by service and usage pattern. Export as professional PDF reports for proposals and contracts.
Reserved Instance and Savings Plans analysis: Before committing to 1-year or 3-year contracts, model the savings. Input your baseline usage, compare On-Demand costs against RI/SP discounted rates, and calculate break-even points. Ensure the commitment makes financial sense before purchase.
Multi-region cost comparison: Pricing varies significantly across AWS regions. Model identical architectures in different regions to identify the most cost-effective deployment location. Balance cost savings against latency requirements for your users.
What-if scenario planning: Explore how usage changes impact costs. Model different scenarios: “What if traffic doubles?” “What if we move from MySQL RDS to Aurora?” “What if we implement aggressive S3 lifecycle policies?” The calculator lets you test assumptions without spending money.
When to Use AWS Cost Explorer
Choose Cost Explorer when you need to analyze actual spending, identify optimization opportunities, or understand historical patterns in your existing AWS environment.
Monthly financial reporting: Finance teams need accurate spending data for reconciliation, variance analysis, and reporting to executives. Cost Explorer provides the source of truth for AWS spending, filterable by dimensions relevant to your organization (department, project, customer).
Cost optimization initiatives: When tasked with reducing AWS costs, start with Cost Explorer. Identify your top spending services, analyze usage patterns, and spot waste. Filter to EC2 costs, examine instance types, identify over-provisioned resources. Export data for deeper analysis in spreadsheets or BI tools.
Budget monitoring and alerting: Track actual spending against approved budgets. Set up cost anomaly detection to catch unexpected spikes before they devastate budgets. Get alerts when specific services or accounts exceed thresholds, enabling rapid response to misconfigured resources.
Reserved Instance and Savings Plans management: After purchasing commitments, track utilization and coverage rates. Cost Explorer shows whether you’re using 90% of your Reserved Instance (good) or 40% (wasted commitment). Identify expiring RIs that need renewal or conversion to Savings Plans.
Chargeback and showback models: Organizations with multiple business units or customers need to attribute costs accurately. Use Cost Explorer with consistent tagging strategies (Project: mobile-app, Customer: acme-corp, Environment: production) to generate department-specific or customer-specific cost reports.
Trend analysis for growth planning: Examine 6-12 month trends in compute, storage, and data transfer. Identify seasonal patterns, growth trajectories, and usage shifts. Use this data to forecast infrastructure needs and budget for scaling.
Post-deployment validation: After launching new infrastructure, compare actual costs against Pricing Calculator estimates. Large discrepancies reveal gaps in planning assumptions (forgot about data transfer, underestimated storage growth) that inform future estimation accuracy.
Incident investigation: When your AWS bill suddenly doubles, Cost Explorer helps you diagnose the cause. Filter by date to isolate the spike, group by service to identify which component drove costs, drill down to specific usage types to understand the root cause (traffic surge, misconfigured auto-scaling, forgotten test resources).
The Complementary Workflow: Using Both Tools Together
The most effective FinOps practitioners use both tools in sequence, leveraging their complementary strengths.
Phase 1: Planning with Pricing Calculator
Before deploying new infrastructure:
- Design your architecture (compute, storage, database, networking)
- Build a detailed estimate in Pricing Calculator
- Model different configurations and commitment options
- Export estimate for budget approval
- Document assumptions (traffic patterns, growth rates, usage hours)
Phase 2: Deployment with Cost Tracking
During deployment:
- Tag all resources consistently (Environment, Project, Owner, CostCenter)
- Enable Cost Explorer (usually enabled by default)
- Set up AWS Budgets with alerts at 50%, 80%, 100% of projected costs
- Document deployment date for future comparison
Phase 3: Analysis with Cost Explorer
After deployment (30-90 days):
- Compare actual costs in Cost Explorer against Pricing Calculator estimate
- Analyze variances—which services cost more/less than expected?
- Identify optimization opportunities (rightsizing, commitment discounts)
- Update estimation assumptions for future projects based on learnings
Phase 4: Continuous Optimization
Ongoing:
- Weekly Cost Explorer reviews to catch anomalies early
- Monthly deep-dive analysis with filtering and grouping
- Quarterly RI/SP utilization reviews and renewals
- Annual trend analysis for long-term capacity planning
Example Workflow: E-commerce Platform Launch
Week -8 (Planning): Use Pricing Calculator to estimate infrastructure for new e-commerce platform. Model web tier (10 × m5.large EC2), database (RDS Aurora MySQL), storage (S3 for images), CDN (CloudFront), and networking. Estimate: $8,500/month.
Week -4 (Budget Approval): Export estimate as PDF, present to CFO. Secure $10,000/month budget (buffer for growth).
Week 0 (Launch): Deploy infrastructure with tags (Project: ecommerce-v2, Environment: production, Owner: platform-team). Actual launch configuration matches estimate.
Week 4 (First Review): Cost Explorer shows actual costs: $11,200/month. Variance analysis reveals data transfer costs are 2× estimate (underestimated product image downloads). Web tier is only 60% utilized (over-provisioned). Database costs match.
Week 8 (Optimization): Implement CloudFront caching to reduce origin requests and data transfer (-$1,800/month). Downsize web tier from m5.large to m5.medium based on rightsizing recommendations (-$800/month). New actual costs: $8,600/month—within budget and aligned with updated usage reality.
Month 6 (Commitment Review): Cost Explorer recommends 3-year Compute Savings Plan for baseline web tier usage. Calculate savings: $5,160/year (20% reduction on committed portion). Purchase Savings Plan, track utilization in Cost Explorer monthly.
This iterative workflow—estimate, deploy, analyze, optimize—creates a continuous improvement cycle that aligns AWS spending with business value.
Common Pitfalls and How to Avoid Them
Pitfall 1: Treating Pricing Calculator Estimates as Guarantees
Problem: Teams budget exact amounts from Pricing Calculator estimates without buffers, then face budget shortfalls when actual costs exceed projections.
Solution: Add 20-30% buffer to calculator estimates for unforeseen usage patterns (traffic spikes, data transfer, development environments). Document all assumptions explicitly. Compare estimates against actuals after deployment to improve future estimation accuracy.
Pitfall 2: Ignoring Data Transfer Costs
Problem: Pricing Calculator users often focus on compute and storage while overlooking data transfer, which can represent 15-30% of total costs for data-intensive applications.
Solution: Explicitly model data transfer in all estimates. Include egress to internet, cross-region transfer, and inter-AZ traffic. Use realistic traffic patterns based on similar existing applications or conservative projections.
Pitfall 3: Not Tagging Resources for Cost Attribution
Problem: Cost Explorer can only group costs by tags if resources are tagged consistently. Untagged resources appear as “no tag” in reports, preventing accurate cost attribution.
Solution: Establish tagging standards before deployment (required tags: Project, Environment, Owner, CostCenter). Enforce tagging through AWS Organizations service control policies or automated compliance scanning. Audit tag coverage quarterly.
Pitfall 4: Analyzing Costs Without Context
Problem: Teams panic over cost increases shown in Cost Explorer without understanding whether growth is legitimate business expansion or wasteful spending.
Solution: Always correlate cost trends with business metrics (user growth, transaction volume, feature launches). 30% cost increase aligned with 40% user growth is healthy efficiency. 30% cost increase with flat usage indicates waste requiring investigation.
Pitfall 5: Forgetting to Review Reserved Instance Utilization
Problem: Organizations purchase Reserved Instances for cost savings but never monitor utilization. Underutilized RIs (60% utilization) waste money rather than saving it.
Solution: Monthly RI/SP utilization reviews in Cost Explorer. Target >90% utilization for Standard RIs, >80% for Convertible RIs. If utilization drops, consider selling on RI Marketplace or converting to Savings Plans for flexibility.
Frequently Asked Questions
Q: Can AWS Pricing Calculator show my actual costs? A: No, AWS Pricing Calculator only provides estimates for proposed infrastructure. It has no access to your actual AWS account data. To see actual costs, use AWS Cost Explorer, which analyzes your real billing information.
Q: Is AWS Cost Explorer free to use? A: Yes, AWS Cost Explorer is free with no additional charges. However, accessing the Cost Explorer API programmatically may incur nominal charges ($0.01 per request). The web interface and basic reporting features are completely free.
Q: How accurate is AWS Pricing Calculator? A: Pricing Calculator accuracy depends entirely on your input assumptions. If you accurately model usage patterns (hours, data volumes, traffic), estimates can be within 10-20% of reality. However, incorrect assumptions about data transfer, storage growth, or usage patterns can cause significant variances. Always include buffers in budgets.
Q: Can I export data from Cost Explorer for custom analysis? A: Yes, Cost Explorer allows CSV export of cost and usage data. You can also access data programmatically via the AWS Cost Explorer API for integration with business intelligence tools, custom dashboards, or automated reporting pipelines.
Q: How far back does Cost Explorer historical data go? A: Cost Explorer provides up to 13 months of historical cost and usage data. For longer retention, enable AWS Cost and Usage Reports (CUR), which store unlimited historical data in S3 for custom analysis with Amazon Athena or third-party tools.
Conclusion: Mastering Both Tools for AWS Cost Excellence
Understanding the AWS Pricing Calculator vs Cost Explorer distinction is fundamental to effective cloud financial management. At GoCloud, these tools aren’t competitors—they’re complementary components of a mature FinOps practice, each serving a distinct purpose in your cost optimization journey.