

AWS Cost Anomaly Detection is a free tool within AWS Cost Management that leverages machine learning models to analyze your historical resource usage, establish a dynamic spending baseline, and automatically flag deviations that look like cost spikes or unexpected overruns. It integrates natively with AWS Cost Explorer, Amazon SNS, and AWS Chatbot, making it a cornerstone capability for any FinOps on AWS practice.
Unlike a static budget rule that fires when you cross a fixed dollar threshold, AWS Cost Anomaly Detection understands your spending rhythm — it knows that your EC2 costs surge every Monday morning when batch jobs run, and it won’t alert you for that. It will, however, alert you when a new data-transfer pattern in S3 triples your storage bill at 2 a.m. on a Saturday.
What It Detects (Spikes vs. Normal Variation)
AWS cost spike detection focuses on statistically significant deviations from your established baseline. It can detect:
- Sudden cost spikes in individual AWS services (EC2, S3, RDS, Lambda, etc.)
- Unexpected increases across a linked AWS account or organizational unit
- Anomalies segmented by cost allocation tags or custom cost categories
- Both absolute anomalies (e.g., $500 over expected spend) and percentage anomalies (e.g., 40% above baseline)
What It Does NOT Do (Set Expectations)
AWS Cost Anomaly Detection is not a catch-all. Specifically, it does not:
- Prevent overspending proactively (it detects, it does not block)
- Map unit costs per customer, team, or feature (no unit economics layer)
- Replace a full FinOps platform for cost allocation or showback/chargeback
- Guarantee zero false positives — tuning is still required, especially in volatile workloads
How AWS Cost Anomaly Detection Works (Behind the Scenes, Simply)
Understanding how AWS Cost Anomaly Detection works demystifies why it catches things static budgets miss. The pipeline follows this sequence:
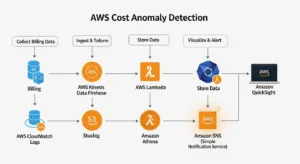
- Data Collection — The service collects billing data, resource utilization metrics, and historical cost records across all monitored accounts and services — including granular details on EC2 instances, S3 storage, RDS clusters, and hundreds of other AWS services.
- Historical Data Analysis — Machine learning algorithms analyze weeks or months of your historical spending to build a behavioral model. This is not a simple rolling average — the model accounts for day-of-week patterns, growth trends, and seasonal workload variations.
- Anomaly Detection — The trained model monitors spend in real-time, comparing actual costs against predicted spend at each evaluation interval.
- Threshold Calculation & Anomaly Identification — When actual spend deviates beyond either the ML-calculated dynamic threshold or your custom-defined threshold, the deviation is flagged as an anomaly.
- Alert Generation — Alerts are dispatched via your chosen channel (email, Amazon SNS topic, or Slack via AWS Chatbot).
- Root Cause Analysis — Detected anomalies are enriched with root cause attribution: which service, linked account, cost category, or tag dimension is the primary driver.
Baselines and Dynamic Thresholds :
Unlike AWS Budgets — which uses a static dollar or percentage ceiling you define — AWS Cost Anomaly Detection builds dynamic thresholds that automatically adjust as your workload evolves. If your company legitimately scales EC2 capacity by 30% over three months, the ML baseline rises with it. This dramatically reduces false positives compared to static budget alerts.
Root-Cause Direction (Service / Account / Category)
When an anomaly fires, the system performs root cause analysis by correlating the spike with changes in: resource utilization patterns, configuration changes, data transfer volumes, or AWS pricing updates. You receive a ranked list of the top contributors — so instead of knowing “costs went up,” you know “RDS read replica in us-east-1 in account production-012345 caused 87% of the spike.”
Monitor Types You Can Create (And When to Use Each)
Cost monitors AWS configuration is the first decision you make. There are four distinct monitor types, each suited to different organizational needs.
AWS Services Monitor :
The AWS services monitor watches for anomalies at the individual service level across your entire account — for example, unexpected spikes in Amazon S3 storage costs, unusual Amazon RDS query volumes, or EC2 usage surges. This is the right starting point for teams that don’t yet segment by environment or organization. It’s the simplest cost monitors AWS configuration and the best entry point for a single-account setup.
Cost Category Monitor :
Cost categories let you group AWS spending by custom dimensions — for example, mapping all resources tagged env:production plus a specific set of AWS accounts into a “Production” category. A cost category monitor watches for anomalies within that custom grouping. This is ideal for platform teams that want environment-level anomaly detection (dev vs. staging vs. prod) and for finance teams who already use cost categories for chargeback.
Linked Accounts Monitor :
For AWS Organizations setups, the linked accounts monitor watches spending across multiple member accounts simultaneously. This is the go-to choice for organizations with separate AWS accounts per team, product line, or business unit. It provides centralized cost visibility while still being able to pinpoint which account triggered the anomaly — essential for FinOps anomaly detection AWS at scale.
Cost Allocation Tag Monitor :
Similar to linked accounts, but uses cost allocation tags (e.g., project:payments-api, team:data-engineering) as the segmentation dimension. This offers more granular monitoring for organizations that manage infrastructure across shared accounts but tag resources meticulously. If your AWS bill is already well-tagged, this is your most powerful monitor type for precise root-cause attribution.
AWS Cost Anomaly Detection vs AWS Budgets (Critical Differences)
This is one of the most-searched questions in cloud cost management: AWS Cost Anomaly Detection vs Budgets — and the answer matters for how you architect your alerting strategy. Use both; they are complementary, not competing.
| Feature | AWS Cost Anomaly Detection | AWS Budgets |
| Alert type | Dynamic, ML-driven anomaly | Static threshold breach |
| Requires manual threshold | Optional (ML sets baseline automatically) | Required (you define the number) |
| Handles seasonal variation | ✅ Yes — baseline adjusts dynamically | ❌ No — static threshold ignores patterns |
| Root cause analysis | ✅ Built-in attribution to service/account/tag | ❌ Not available |
| False positive rate | Lower (ML filters normal variation) | Higher (static thresholds fire on expected peaks) |
| Use case | Catch unexpected spikes you didn’t anticipate | Enforce hard budget limits for planned spend |
| Pricing | Free | First 2 budgets free; $0.02/day per budget after |
| Alert channels | Email, SNS, Slack (via Chatbot) | Email, SNS, Slack (via Chatbot), Chime |
| Coverage | AWS Cost Explorer data (requires CE enabled) | Any AWS cost/usage dimension |
Bottom line: Use AWS Budgets to enforce known spending ceilings. Use AWS Cost Anomaly Detection to catch unknown anomalies you couldn’t have pre-defined a threshold for. The most resilient FinOps setups run both.
Benefits + Limitations (Pros and Cons)
Benefits :
- Avoid surprise bills: Automated, near-real-time detection means you find out about a runaway EC2 fleet in hours, not at month-end billing. Amazon SNS integration lets you push alerts directly to Slack channels where your on-call engineers already live.
- Automated ML insights: The machine learning baseline eliminates the manual work of defining “what normal looks like” for dozens of services and accounts. This significantly reduces your team’s monitoring burden.
- Better spend visibility: The anomaly dashboard in AWS Cost Explorer surfaces cost drivers you might never have noticed — contributing to a richer understanding of your overall AWS spend profile.
- Customizable alerting: Set thresholds per monitor, choose individual/daily/weekly alert frequency, and segment by service, account, tag, or category to match your operational model.
- Free to use: There is no additional charge for AWS Cost Anomaly Detection beyond the normal Cost Explorer data ingestion costs.
Limitations :
- Manual configuration still required: You must define monitor types, set threshold preferences, and configure alert subscriptions. The ML does the detection, but setup is on you.
- No unit cost mapping: It identifies which AWS services are spiking, but cannot map costs to unit economics (cost per customer, per API call, per active user). That requires a separate FinOps cost allocation layer.
- Limited data scope: The ML model analyzes billing data available in Cost Explorer. If Cost Explorer data is delayed or incomplete (e.g., Credits, refunds), detection accuracy can be affected.
- False positives still possible: Highly volatile workloads (e.g., bursty batch processing, traffic-driven auto-scaling) can still generate noisy alerts without careful threshold tuning.
How to Set Up AWS Cost Anomaly Detection (Step-by-Step)
Here is a complete walkthrough to set up AWS Cost Anomaly Detection from scratch.
Step 0 — Enable AWS Cost Explorer :
AWS Cost Anomaly Detection requires AWS Cost Explorer to be active. Navigate to Billing and Cost Management → Cost Explorer and click Enable Cost Explorer. Note that Cost Explorer can take up to 24 hours to populate historical data after first activation. This is a one-time prerequisite.
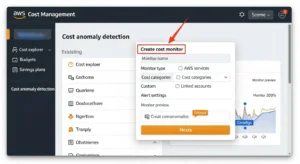
Step 1 — Create a Cost Monitor :
- Go to AWS Cost Management Console → Cost Anomaly Detection → Cost monitors tab
- Click Create monitor
- Choose your monitor type (AWS services, cost category, linked accounts, or cost allocation tag)
- Give the monitor a descriptive name (e.g., production-ec2-monitor or data-team-tag-monitor)
- For linked accounts or tag monitors, specify which accounts/tags to include
Step 2 — Create an Alert Subscription (Threshold + Frequency)
- Under Alert subscription, choose Create a new subscription
- Enter a Subscription name
- Set Alerting frequency: Individual alerts (immediate), Daily summary, or Weekly summary
- Add Alert recipients (email addresses)
- Set your Threshold type:
- Absolute: Alert when anomaly impact exceeds a fixed dollar amount (e.g., $100)
- Percentage: Alert when actual spend exceeds expected spend by a percentage (e.g., 20%)
- Click Create monitor
Pro tip: Start with a $50 absolute threshold and Individual alerts for your first monitor. You can loosen thresholds as you calibrate false positives over the first few weeks.
Step 3 — Triage an Alert (What to Check First)
When an AWS cost spike alert arrives:
- Open the Anomaly Detection dashboard in Cost Explorer
- Click the anomaly to see the root cause breakdown (top contributing service/account/tag)
- Cross-reference with CloudTrail for configuration changes in the same time window
- Check Auto Scaling activity or data transfer logs for the implicated service
- Resolve the root cause (resize, terminate, fix configuration), then add a note in the anomaly record
Tutorial: Send AWS Cost Anomaly Alerts to Slack (AWS Chatbot + SNS)
AWS Cost Anomaly Detection Slack alerts via AWS Chatbot are the gold standard for engineering team awareness. Here is the complete setup walkthrough.
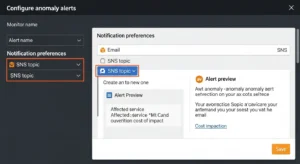
1) Create / Choose an SNS Topic :
- Navigate to Amazon SNS → Topics → Create topic
- Choose Standard type, give it a name (e.g., cost-anomaly-alerts)
- Note the ARN — you’ll reference this in your Cost Anomaly Detection alert subscription
- Back in Cost Anomaly Detection, edit (or create) an alert subscription and set the SNS topic ARN as the recipient instead of (or in addition to) email
- Save the subscription
2) Configure AWS Chatbot for Slack :
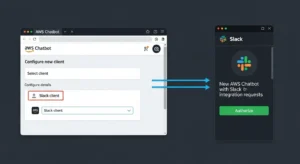
- Open the AWS Chatbot console
- Under Chat clients, select Slack and click Configure client
- Authorize AWS Chatbot to access your Slack workspace (OAuth prompt in Slack)
- Click Configure a new channel
- Enter a Configuration name (e.g., finops-cost-alerts)
- In Slack, right-click your target channel → Copy link → paste the channel ID into the Channel ID field in the Chatbot console
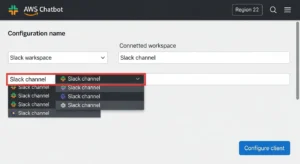
- Under IAM role, create or select an existing role (use the Notification permissions template if creating new — this grants read-only SNS/CloudWatch access)
- Under SNS topics, select the SNS topic you created in step 1 (you can add topics from multiple regions)
- Click Configure
3) Validate Notifications and Reduce Noise :
- Trigger a test notification by publishing a test message to the SNS topic from the SNS console
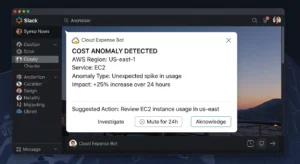
- Confirm the formatted alert appears in your Slack channel
- If you’re seeing too much noise: raise the absolute threshold in your alert subscription (e.g., from $50 to $200), or switch from Individual alerts to Daily summary
- For high-frequency environments, consider creating separate monitors per team with separate SNS topics and Slack channels — this prevents alert fatigue in a shared #engineering channel
Best Practices (Reduce False Positives + Faster Root Cause)
Use Meaningful Cost Categories and Tags :
Cost allocation tags are your best friend for root-cause precision. Before creating monitors, ensure all production resources are tagged with project, team, environment, and owner. Without tags, a spike in shared infrastructure becomes an undifferentiated line item. Tag-based and cost category monitors surface anomalies at the dimension that matters to your business — not just at the raw AWS service level.
Segment by Account / Environment :
Avoid creating a single omnibus monitor for your entire AWS Organization. Instead, create separate linked account monitors for production, staging, and development. Production anomalies warrant immediate paging; a dev environment cost spike can wait for a daily summary. This segmentation is also critical for reduce false positives cost anomaly detection dev and staging workloads are naturally more volatile.
Choose Thresholds That Match Spend Volatility :
A $100 absolute threshold is noise for a team spending $50,000/month; it’s a legitimate alarm for a team spending $2,000/month. Rule of thumb: set your anomaly threshold at 1–3% of your typical monthly spend for the scope of that monitor. Revisit thresholds quarterly as your baseline spend evolves.
Combine with Budgets + an Incident Process :
AWS Cost Anomaly Detection catches unexpected spikes. AWS Budgets enforces known spending ceilings. Combine them:
- AWS Budgets → alert at 80% and 100% of monthly forecast
- AWS Cost Anomaly Detection → alert on any unexpected spike above threshold
- Map both alert types to the same Slack channel with a documented runbook for triage: check root cause → determine if expected → escalate or resolve → add anomaly note
This combination gives you both proactive guardrails (Budgets) and reactive intelligence (Anomaly Detection) — the two pillars of a mature FinOps on AWS practice.
FAQs :
Q1: Is AWS Cost Anomaly Detection free?
Yes, AWS Cost Anomaly Detection itself is free. You only pay standard AWS Cost Explorer costs for the underlying data, which are minimal for most accounts.
Q2: How long does it take for AWS Cost Anomaly Detection to start working?
The ML model needs enough historical data to establish a baseline — typically at least a few days after Cost Explorer is enabled, with more accurate detection after two to four weeks of data.
Q3: What is the difference between AWS Cost Anomaly Detection and AWS Budgets?
AWS Budgets uses static thresholds you define manually, while AWS Cost Anomaly Detection vs Budgets shows a clear distinction: Anomaly Detection uses machine learning to dynamically learn your normal spend pattern and only alerts on genuine deviations — resulting in fewer false positives.
Q4: Can AWS Cost Anomaly Detection alert me in Slack?
Yes. By connecting an Amazon SNS topic to your alert subscription and configuring AWS Chatbot Slack alerts, cost anomaly notifications can appear directly in any Slack channel you specify.
Q5: How do I reduce false positives in cost anomaly detection?
The best approach to reduce false positives cost anomaly detection is to segment monitors (separate by service, account, or environment), raise absolute thresholds above normal spend volatility, and use daily summaries instead of individual alerts for noisier environments.
Conclusion :
AWS Cost Anomaly Detection is a powerful free tool in the AWS Cost Management suite that uses machine learning to identify unusual spending patterns before they become costly surprises. With guidance from GoCloud, businesses can monitor costs across AWS services, accounts, or cost allocation tags, integrate alerts with Slack for quick action, and pair it with AWS Budgets to manage both unexpected and planned spending. By setting meaningful thresholds and reviewing alerts regularly, organizations can maintain transparent, predictable, and optimized cloud costs while improving financial governance.