

Running an optimal cloud on AWS is not just about provisioning the right resources — it is about knowing, in real time, whether those resources are healthy, performing as designed, costing what they should, and behaving securely. That three-part mandate — reliability + performance + cost — is exactly what the best AWS monitoring tools are built to serve.
The challenge is that AWS itself ships with a rich suite of native monitoring services, while a parallel ecosystem of third-party platforms competes for the same observability budget. Choosing between them — or combining them — is one of the most consequential infrastructure decisions a platform team makes. This guide covers the complete AWS monitoring tools landscape: native options, third-party alternatives, how to pick the right stack for your stage, and the best practices that separate reactive firefighting from proactive cloud excellence.
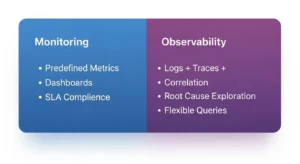
Monitoring vs Observability on AWS :
Before evaluating any tool, you need to clarify what problem you are actually trying to solve. Monitoring vs observability on AWS is not a semantic debate — it directly determines which tools belong in your stack.
| Aspect | Monitoring | Observability |
| Primary Focus | Tracks known metrics (CPU, memory, latency, errors) | Explores unknown issues across logs, metrics, and traces |
| Key Question | Is the system working as expected? | Why is the system behaving this way? |
| Use Case | Alerting, uptime checks, SLA/SLO compliance | Root cause analysis, performance optimization |
| Data Scope | Predefined metrics and dashboards | Flexible queries across logs, metrics, and traces |
| Example Tools | Amazon CloudWatch, AWS CloudTrail | Datadog, New Relic, OpenTelemetry-based platforms |
What Monitoring Covers :
Monitoring answers a binary question: is the system up, and is it within acceptable parameters? It relies on predefined signals — CPU utilization on your EC2 fleet, invocation errors on AWS Lambda, connection count on Amazon RDS. When a metric crosses a threshold, an alarm fires. Monitoring is reactive by design and essential for SLA compliance, uptime tracking, and basic incident detection.
What Observability Adds (Logs + Traces + Correlation)
Observability extends monitoring with the ability to interrogate unknown failure modes. A system is observable when you can answer arbitrary questions about its internal state using its outputs alone — without needing to re-deploy instrumentation. In practice, that means combining metrics (what), logs (what happened), and traces (why it happened and where in the request chain). AWS X-Ray brings distributed tracing to AWS-native observability; Datadog and New Relic extend this into full-stack correlation across microservices.
Quick Decision: When You Need Each :
- You need monitoring if: you want alarms, dashboards, uptime checks, and SLA/SLO tracking
- You need observability if: you run microservices, distributed systems, or serverless architectures where a single request touches 5+ services and failures are hard to localize
- You need both if: you are post-product-market-fit, running production traffic, and care about P95 latency as much as uptime
What to Look for in AWS Monitoring Tools (Selection Criteria)
Not all AWS monitoring tools are equal, and the “best” tool depends entirely on your maturity, team size, and workload. Evaluate every candidate against this feature checklist before committing.
Metrics Collection :
The foundation. Look for: out-of-the-box AWS service metrics (no agent required), custom metrics via API or SDK, high-resolution metrics (sub-minute granularity for latency-sensitive workloads), and support for dimensional filtering (e.g., by instance ID, region, or account).
Dashboards & Visualization :
Dashboards are the operational interface your team uses under pressure. Prioritize: customizable layouts, shareable URLs for incident bridges, support for multiple data sources in a single view, and mobile-friendly status views for on-call engineers.
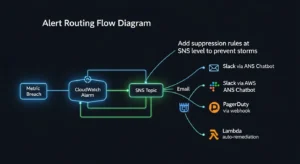
Alerting & Routing :
Alerts are only valuable if they reach the right person at the right time. Key capabilities: threshold-based and anomaly-based alerting, routing to Slack, PagerDuty, or OpsGenie, alert suppression and silencing windows, and alert grouping to prevent notification storms during cascading failures.
Log Management :
Logs are your audit trail and your deepest debugging signal. Evaluate: centralized log aggregation (CloudWatch Logs Groups, S3 archival), full-text search latency, structured log parsing (JSON), retention policies, and cross-account log aggregation for multi-account organizations.
Tracing (Distributed Systems)
In a microservices or serverless architecture, a single user request can traverse a dozen AWS services. Distributed tracing connects those hops into a single timeline. Look for: AWS X-Ray compatibility, OpenTelemetry support (vendor-neutral instrumentation), service map visualization, and trace sampling controls to manage cost at scale.
Integrations & Automation :
The best AWS observability tools don’t live in isolation. Check for: native AWS service integrations (EC2, Lambda, RDS, S3, ECS, EKS), Terraform/CDK provider support for IaC-managed alerting, CI/CD pipeline hooks for deployment context in dashboards, and webhook or API extensibility.
Anomaly Detection (Behavioral Baselines)
Static CPU thresholds are a 2015 approach. Modern tools use ML-powered baselines to detect anomalies relative to your historical normal, dramatically reducing false positives. CloudWatch Anomaly Detection, Datadog’s ML-powered alerts, and New Relic’s Applied Intelligence all provide this capability — but the sophistication and configurability vary significantly.
Native AWS Monitoring Tools (Best First-Line Options)
AWS ships a mature portfolio of monitoring services that are deeply integrated with every managed service. For most teams, this is where any monitoring strategy begins.
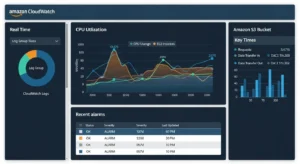
Amazon CloudWatch :
What it does: CloudWatch is the primary AWS monitoring service — it collects metrics, aggregates logs, fires alarms, and powers automated responses across virtually every AWS service.
Best for: Any team running workloads on AWS. It is the unavoidable baseline.
Key features:
- Default metrics for EC2, Lambda, RDS, S3, and 70+ AWS services with zero agent installation
- CloudWatch Logs for centralized log storage, search, and metric filters
- CloudWatch Alarms with SNS integration for email, Slack, and PagerDuty routing
- CloudWatch Anomaly Detection — ML-powered dynamic baselines per metric
- Composite Alarms for grouping related conditions to reduce alert noise
- Application Insights and Container Insights for deeper runtime visibility
Pros: Zero-friction integration with all AWS services; no agents needed; powers Lambda auto-scaling and EC2 Auto Scaling reactions; cost scales with usage.
Cons: Dashboard UX is functional but not beautiful; cross-account aggregation requires additional setup; log search is slow for large volumes compared to dedicated log platforms.
AWS CloudTrail :
What it does: CloudTrail records every API call made in your AWS account — who did what, from where, and when. It is your security audit log and compliance backbone.
Best for: Security teams, compliance requirements (SOC 2, PCI-DSS, HIPAA), incident forensics, and change attribution.
Key features:
- Complete history of AWS Management Console actions, SDK calls, and CLI commands
- Multi-region trails with S3 archival and CloudWatch Logs integration
- CloudTrail Insights for detecting unusual API activity patterns
- Integration with AWS Security Hub for centralized security findings
Pros: Indispensable for security auditing; enables forensic root-cause analysis after incidents; satisfies most audit requirements out of the box.
Cons: High log volume in active accounts; storage costs can accumulate; requires Athena or a SIEM to query at scale meaningfully.
AWS Config :
What it does: AWS Config continuously tracks the configuration state of every AWS resource — what it looked like, when it changed, and whether it currently complies with your defined rules.
Best for: Governance, compliance auditing, drift detection, and security posture management.
Key features:
- Configuration change timeline for every tracked resource
- Conformance Packs for pre-built compliance frameworks (CIS, NIST, PCI)
- Auto-remediation via AWS Systems Manager when non-compliant configurations are detected
- Integration with AWS Security Hub for unified compliance dashboards
Pros: The only native tool that answers “what changed and when” at the configuration level; essential for regulated industries.
Cons: Config rules evaluation charges can grow quickly in large accounts; does not cover application-layer behavior.
AWS X-Ray :
What it does: X-Ray provides distributed tracing for applications running on AWS — connecting the dots across Lambda functions, EC2 services, API Gateway, and downstream databases into a unified request timeline.
Best for: Microservices, serverless architectures, and any application where a user request touches multiple services.
Key features:
- Service map visualization showing inter-service dependencies and latency
- Trace sampling to manage overhead and cost at high request volumes
- Annotations and metadata for filtering traces by business context
- Native integration with Lambda, ECS, EC2, API Gateway, and App Mesh
- OpenTelemetry compatibility for vendor-neutral instrumentation
Pros: Tightly integrated with Lambda and other managed services; service maps are genuinely useful for first-responders during incidents.
Cons: Sampling can miss rare failure modes; cross-account tracing requires additional configuration; UI is less polished than Datadog APM or New Relic traces.
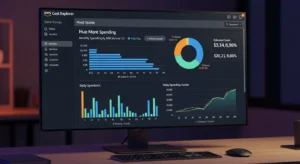
AWS Cost Explorer (Cost Visibility Tie-In)
What it does: Cost Explorer is the native AWS cost monitoring tool — it visualizes historical spend, forecasts future costs, and identifies savings opportunities across your AWS accounts.
Best for: FinOps leads, CTOs, and engineering managers who need cost as a first-class operational signal alongside performance metrics.
Key features: Spend breakdown by service, region, account, and tag; 12-month cost forecasts; Reserved Instance and Savings Plan coverage recommendations; Right Sizing recommendations for EC2.
Pros: Free to use (Cost Explorer activation is free); integrates with AWS Cost Anomaly Detection for ML-powered spend spike alerts.
Cons: Steep learning curve for non-FinOps users; no unit cost mapping (costs per customer or feature require additional tooling).
Amazon EC2 Dashboard :
What it does: The EC2 Dashboard provides instance-level monitoring of CPU utilization, disk I/O, network throughput, and instance status checks — built directly into the EC2 console.
Best for: Teams with smaller, EC2-centric workloads who want a quick operational view without additional tooling.
Key features: Instance status checks; CloudWatch metrics embedded in console; alarm configuration from the instance detail view.
Pros: Zero setup; immediate visibility for anyone in the AWS Console.
Cons: EC2-only; no cross-service or application-layer visibility; not suitable as a primary monitoring plane for modern multi-service architectures.
Best Third-Party AWS Monitoring Tools (When Native Isn’t Enough)
Native tools cover the what of your infrastructure. Third-party platforms add the why, the who, and the so what — with better UX, cross-cloud support, and richer correlation across the full application stack.
Datadog :
Overview: Datadog is the market-leading unified observability platform, covering infrastructure metrics, APM, logs, real user monitoring, and security in a single product. Its AWS integration is the deepest of any third-party tool, with 600+ supported integrations.
Key features: AI-powered anomaly detection and watchdog alerts; distributed APM with flame graphs; log management with ML-powered parsing; infrastructure maps; cloud cost management module; SLO tracking dashboards.
Ideal use cases: CloudWatch vs Datadog for AWS — teams that need correlated metrics + APM + logs in one view, have multi-cloud or hybrid infrastructure, or want developer-friendly dashboards rather than AWS console UX.
Pricing model notes: Per-host per-month pricing for infrastructure monitoring; per-GB ingested for logs; ACU-based for serverless. Can become expensive at scale without carful data retention and sampling configuration.
Trade-offs: Best-in-class UX and correlation capabilities; significantly higher cost than native-only approaches; vendor lock-in risk for custom instrumentation.
New Relic :
Overview: New Relic offers full-stack observability with a generous free tier and a consumption-based pricing model that rewards efficient data ingestion. Strong in APM, browser monitoring, and mobile performance.
Key features: AI-powered incident detection (Applied Intelligence); unified telemetry data platform for metrics, events, logs, and traces; infrastructure monitoring with auto-discovery; customizable NRQL query language for ad-hoc analysis.
Ideal use cases: Teams that want full observability but need predictable pricing; organizations migrating from on-premises APM tools (like AppDynamics); SRE teams building SLO workflows.
Pricing model notes: Free tier includes 100 GB/month data ingest + 1 full user. Paid plans billed per GB ingested and per full-platform user — often more cost-predictable than Datadog for log-heavy environments.
Trade-offs: Powerful query capabilities; UI can feel overwhelming for first-time users; AWS-specific integrations slightly less turnkey than Datadog’s.
Grafana + Prometheus (Open-Source Route)
Overview: The open-source observability stack of choice for cost-conscious engineering teams. Prometheus scrapes metrics from AWS targets (via exporters or CloudWatch integration); Grafana visualizes them in highly customizable dashboards. Grafana Cloud provides managed hosting with a generous free tier.
Key features: PromQL for powerful metric queries; AlertManager for routing to PagerDuty, Slack, and email; Grafana dashboards with hundreds of pre-built AWS templates; Loki for log aggregation (Grafana’s log storage layer); Tempo for distributed tracing.
Ideal use cases: Teams with Kubernetes-heavy workloads (Prometheus is the CNCF standard for k8s monitoring); organizations with strong open-source culture; multi-cloud environments where vendor lock-in is a concern.
Pricing model notes: Self-hosted is free (you pay only for infrastructure); Grafana Cloud managed tier starts free up to 10,000 series. The true cost is engineering time for setup and ongoing maintenance.
Trade-offs: Maximum flexibility and zero licensing cost; highest operational overhead of any option on this list; incident support requires community or Grafana Enterprise contract.
Splunk Observability (Enterprise)
Overview: Splunk is the enterprise standard for log management and SIEM, and its Observability Cloud extends that into infrastructure monitoring and APM. Best suited for organizations that already invest in Splunk for security and compliance.
Key features: Streaming metrics pipeline with sub-second alerting latency; SignalFx APM with NoSample™ full-fidelity tracing; Log Observer for correlating logs with traces; Splunk ITSI for IT Service Intelligence workflows.
Ideal use cases: AWS monitoring tools for security auditing in regulated industries; large enterprises with existing Splunk SIEM investments; organizations requiring SOC 2 / FedRAMP compliance audit trails.
Pricing model notes: Enterprise licensing with significant per-GB ingest cost; typically the most expensive option on this list. Reserved capacity pricing available for predictable workloads.
Trade-offs: Unmatched at log-volume scale and security correlation; cost and complexity make it inappropriate for startups or teams below ~200 engineers.
Elastic Observability (Logs-Heavy Organizations)
Overview: Elastic (the ELK Stack: Elasticsearch + Logstash + Kibana) evolved into a full observability platform with APM, infrastructure monitoring, and SIEM. Best for organizations with high log volumes who want powerful search.
Key features: Near-real-time full-text log search at petabyte scale; Elastic APM with OpenTelemetry support; Universal Profiling for CPU flame graphs; AWS Firehose integration for direct log streaming.
Ideal use cases: Log-heavy architectures (e-commerce, fintech audit trails); teams already using Elasticsearch for search; organizations wanting a single platform for observability + security analytics.
Pricing model notes: Elastic Cloud on AWS starts at consumption-based rates; self-managed is open-source (Apache 2.0/SSPL). Storage costs are the dominant factor.
Trade-offs: Best log search experience of any platform; steeper operational learning curve than Datadog or New Relic; APM features lag behind Datadog in depth.
Sentry (Application Error Monitoring)
Overview: Sentry is the specialist tool for application-level error tracking and performance monitoring. While not an infrastructure monitoring platform, it fills a critical gap: catching exceptions, stack traces, and regressions that no infrastructure metric would ever surface.
Key features: Automatic error grouping and deduplication; source map support for frontend JS; release tracking with regression detection; performance monitoring with transaction tracing; integration with GitHub, Jira, and Slack.
Ideal use cases: Every software team shipping production code, used alongside (not instead of) infrastructure monitoring; particularly valuable for Lambda-based applications where cold-start errors and application exceptions are invisible in CloudWatch without custom error parsing.
Pricing model notes: Free tier for small teams; paid plans per event volume. Typically the lowest-cost observability investment with the highest developer-experience return.
Trade-offs: Application layer only; no infrastructure metrics or distributed tracing at the infrastructure level. Essential complement to CloudWatch, not a replacement.
Comparison Tables (Featured Snippet Targets)
Native vs Third-Party: Cost, Depth, Setup Time :
| Dimension | Native AWS Tools | Third-Party Tools |
| Upfront cost | Low (pay per usage) | Medium–High (licensing + ingest) |
| Setup time | Minutes (auto-discovery) | Hours–Days (agent deploy + config) |
| AWS integration depth | Native — zero lag | API-based — slight polling delay |
| Cross-cloud support | AWS only | Multi-cloud (Azure, GCP, on-prem) |
| UX / Developer experience | Functional but not modern | Generally superior dashboards |
| Distributed tracing | AWS X-Ray (limited) | Full APM (Datadog, New Relic) |
| Log search at scale | CloudWatch Logs (adequate) | Elastic, Splunk (superior) |
| Anomaly detection | CloudWatch (basic ML) | Advanced ML (Datadog Watchdog) |
| Compliance / audit logs | CloudTrail, Config (excellent) | Splunk, Elastic SIEM (excellent) |
Tool-by-Tool Decision Matrix (Team Size, Maturity, Budget)
| Tool | Team Size | Maturity | Budget | Best When |
| CloudWatch | Any | Any | $ | First-line for all AWS workloads |
| CloudTrail | Any | Any | $ | Always on — compliance baseline |
| AWS Config | Mid–Enterprise | Moderate | $$ | Governance and drift detection |
| AWS X-Ray | Any | Moderate | $ | Serverless / microservices tracing |
| Datadog | Mid–Enterprise | High | $$$$ | Full observability, multi-cloud |
| New Relic | Mid–Enterprise | Moderate | $$$ | APM + predictable pricing |
| Grafana + Prometheus | Any | High (engineers) | $ | Kubernetes, open-source culture |
| Splunk | Enterprise | High | $$$$ | Compliance-heavy, log-volume scale |
| Elastic | Mid–Enterprise | High | $$ | Log-search-primary organizations |
| Sentry | Any | Any | $ | Application error tracking |
Real-World AWS Monitoring Setups (Reference Stacks)
Startup Stack (Cheap + Fast)
Profile: 2–15 engineers, single AWS account, product–market-fit stage, ≤$10K/month AWS spend.
Stack:
- Amazon CloudWatch — metrics, alarms, Logs (everything; zero additional cost)
- AWS CloudTrail — enabled in all regions (mandatory day-one security hygiene)
- Sentry — application errors (free tier sufficient at early stage)
- AWS Cost Explorer + Cost Anomaly Detection — cost visibility (free)
- Alert routing: CloudWatch → SNS → Slack via AWS Chatbot
Total additional cost: ~$0–$50/month beyond CloudWatch usage fees.
Scale-Up Stack (Multi-Account + IaC)
Profile: 15–100 engineers, AWS Organizations with 3–10 accounts, Terraform-managed infrastructure, microservices on ECS or EKS.
Stack:
- Amazon CloudWatch — cross-account dashboards via CloudWatch observability access manager
- AWS X-Ray — distributed tracing for all Lambda and ECS services
- AWS Config — org-wide conformance packs via AWS Control Tower
- Datadog — unified APM, log management, and cross-account infrastructure view
- AWS Cost Anomaly Detection — wired to Slack via SNS + AWS Chatbot
IaC note: All CloudWatch alarms, Datadog monitors, and SNS topics managed as code in Terraform modules to prevent configuration drift.
Enterprise Stack (Compliance + SOC + SLOs)
Profile: 100+ engineers, regulated industry (fintech, healthcare, SaaS), SOC 2 Type II in scope, global user base.
Stack:
- Amazon CloudWatch + Container Insights — EC2, EKS, Lambda metrics
- AWS CloudTrail + Security Hub + Config — full compliance and audit trail
- AWS X-Ray + OpenTelemetry — vendor-neutral distributed tracing
- Splunk SIEM — CloudTrail logs + VPC Flow Logs for security correlation
- Datadog APM + SLO dashboards — service reliability and error budget tracking
- Elastic Observability — high-volume application log archival and full-text search
- AWS Cost Explorer + third-party FinOps tool — unit cost and commitment management
Alert governance: All alerts classified by severity (P1–P4), routed to PagerDuty with escalation policies, SLO burn rate alerts for P1/P2 triggering immediate incident response workflows.
AWS Monitoring Best Practices :
Following the right AWS monitoring best practices is what separates teams that catch issues in minutes from teams that find out at 3 a.m. — or worse, at month-end billing.
Standardize Tags and Account Structure :
Every metric, log, and trace is only as useful as the context attached to it. Enforce consistent resource tagging (environment, team, service, cost-center) before you set up any monitoring — tags are the primary dimension for filtering alerts, dashboards, and cost reports. In multi-account orgs, standardize account naming so cross-account dashboards make sense to a new on-call engineer at 2 a.m.
Use SLOs, Not Only CPU Alarms :
CPU above 80% is not an incident. A user-facing error rate above 0.1% is. Modern AWS monitoring tools support SLO-based alerting — define your reliability targets (99.9% success rate, P95 < 200ms) and alert on error budget burn rate. This shifts your team from infrastructure-centric firefighting to customer-centric reliability engineering.
Alert Fatigue Prevention :
An alarm that fires every day is no alarm at all. Audit your CloudWatch alarms monthly: suppress any alarm that has fired more than 20 times without a corresponding incident action. Use Composite Alarms to combine related conditions (CPU + memory + error rate together) before paging. Use daily summaries for non-urgent signals; reserve immediate pages for P1 conditions only.
Cost Monitoring as a First-Class Signal :
AWS monitoring tools for cost optimization belong on the same dashboard as performance metrics. A service that is running correctly but burning 10× its expected budget is a production incident. Enable AWS Cost Anomaly Detection, wire it to the same Slack channel as your infrastructure alerts, and add a cost burn rate widget to every service team’s dashboard. Cost surprises are usually silent until they are catastrophic — treat cost visibility as a first-class monitoring pillar.
FAQs :
Q1: What are the best AWS monitoring tools in 2026?
The best AWS monitoring tools in 2026 for most teams are Amazon CloudWatch (baseline for all workloads), AWS CloudTrail (security and compliance), and a third-party platform like Datadog or Grafana depending on scale and budget. Start native and add third-party capabilities as your observability maturity grows.
Q2: How do I choose AWS monitoring tools for my team?
When deciding how to choose AWS monitoring tools, evaluate five dimensions: your AWS service mix (EC2-centric vs. serverless vs. containers), team engineering bandwidth (open-source requires more maintenance), compliance requirements, budget constraints, and whether you need multi-cloud visibility. Startups should start with CloudWatch; enterprises should evaluate Datadog or Splunk depending on their log volume and compliance needs.
Q3: What is the difference between monitoring vs observability on AWS?
Monitoring vs observability AWS comes down to: monitoring answers whether your system is healthy using predefined metrics; observability explains why it is misbehaving using flexible queries across metrics, logs, and traces together. CloudWatch is primarily a monitoring tool; Datadog and New Relic are observability platforms.
Q4: Is Amazon CloudWatch enough, or do I need Datadog?
CloudWatch is sufficient for single-account, AWS-native workloads with straightforward alerting needs. CloudWatch vs Datadog for AWS becomes a real decision when you need correlated APM + logs + traces in one view, multi-cloud visibility, developer-friendly UX, or ML-powered anomaly detection beyond CloudWatch’s native capabilities.
Q5: What AWS monitoring tools are best for cost optimization?
The best AWS monitoring tools for cost optimization are AWS Cost Explorer (native, free), AWS Cost Anomaly Detection (ML-powered spend spike alerts, free), and third-party FinOps platforms for unit economics and commitment management. Pair cost monitoring with CloudWatch billing alarms as a hard budget guardrail.
Conclusion :
The AWS monitoring tools landscape in 2026 is rich, powerful, and sometimes overwhelming if organizations do not approach it with a clear strategy. In most cases, the best solution is not relying on a single monitoring tool but creating a layered monitoring stack.
Native AWS services provide the essential foundation for data collection, logging, and compliance, while advanced third-party platforms add deeper analytics, better visualization, and cross-service insights that modern production systems require. With the support of GoCloud, businesses can design an effective monitoring strategy that begins with AWS-native services and then expands with additional tools as infrastructure grows in scale and complexity.