

Your infrastructure is generating thousands of data points every second. Logs are streaming, metrics are spiking, and somewhere in that noise is the signal that tells you something is about to break — or already has. The difference between catching it in seconds versus hours often comes down to one decision: which monitoring tool are you running?
AWS CloudWatch vs Datadog is one of the most common tool decisions engineering teams face in 2026. Both platforms offer infrastructure monitoring, log management, alerting, and application performance insights. But they are built on fundamentally different philosophies — and that difference matters significantly depending on your architecture, team size, and budget.
This guide gives you a complete, technically grounded comparison. We cover what each platform does, where each excels, how pricing actually works in practice, and a clear decision framework for CTOs, developers, DevOps engineers, and startup founders trying to get this decision right.
What Is AWS CloudWatch?
Amazon CloudWatch is the native monitoring and observability service built directly into the AWS ecosystem. It was designed from the ground up to collect, store, and visualize operational data from AWS services — metrics, logs, events, and traces — without requiring any external agent or third-party setup.
If you are running workloads on AWS, CloudWatch is already monitoring them. Over 70 AWS services automatically publish metrics to CloudWatch, including EC2, Lambda, RDS, DynamoDB, ECS, S3, and more. This zero-friction integration is one of CloudWatch’s most compelling strengths.
Key Features of AWS CloudWatch
- Metrics collection: Automatic collection from 70+ AWS services with no configuration required
- CloudWatch Logs: Centralized log storage, querying with CloudWatch Logs Insights (SQL-like syntax), and log-based metric filters
- CloudWatch Alarms: Threshold-based and anomaly detection alarms that trigger SNS notifications, Auto Scaling actions, or Lambda functions
- CloudWatch Dashboards: Unified visualization of metrics and logs from across your AWS environment
- Container Insights: Deep monitoring for ECS and EKS clusters, including CPU, memory, network, and disk I/O
- Lambda Insights: Enhanced monitoring for AWS Lambda function performance, cold starts, and error rates
- CloudWatch Synthetics: Canary testing to proactively monitor API endpoints and website behavior
- CloudWatch ServiceLens: End-to-end service map combining metrics, traces (via AWS X-Ray), and logs for distributed applications
- Contributor Insights: Identifies top contributors to system performance issues from log data
AWS CloudWatch Use Cases
- Pure AWS environments: Monitoring EC2, RDS, Lambda, ECS, and other AWS-native services
- AWS cost monitoring: CloudWatch integrates with AWS Cost Explorer for unified cost and performance visibility
- Auto Scaling triggers: Using alarms to drive dynamic resource scaling based on real-time metrics
- AWS compliance and audit logging: Combining CloudWatch with CloudTrail for comprehensive audit trails
- Serverless application monitoring: First-class Lambda monitoring with automatic instrumentation
What Is Datadog?
Datadog is a cloud-scale SaaS observability platform that unifies infrastructure monitoring, application performance management (APM), log management, security monitoring, and real user monitoring into a single platform. Unlike CloudWatch, Datadog is cloud-agnostic — it monitors AWS, Azure, GCP, Kubernetes, on-premise servers, and hundreds of third-party services through a unified agent and integration framework.
Datadog operates on a host-based agent model. You install the Datadog Agent on your servers, containers, or cloud instances, and it ships metrics, logs, and traces to the Datadog SaaS backend for storage, analysis, and visualization. The platform is recognized as an AWS Advanced Technology Partner, holding AWS Competencies in Migration, DevOps, Containers, and Microsoft Workloads.
Key Features of Datadog
- Infrastructure monitoring: Real-time visibility into hosts, containers, serverless functions, and network devices across any cloud or on-premise environment
- Application Performance Monitoring (APM): End-to-end distributed tracing, service maps, latency analysis, and code profiling across microservices
- Log Management: Centralized log ingestion, parsing, search, and correlation with traces and metrics from a single interface
- Real User Monitoring (RUM): Frontend performance tracking for web and mobile applications, including session replay
- Security Monitoring: CSPM (Cloud Security Posture Management), threat detection, and runtime security monitoring
- Network Performance Monitoring: Traffic flow analysis across applications, containers, availability zones, and on-premise resources
- Synthetic Monitoring: API and browser tests to proactively validate application behavior from global locations
- Continuous Code Profiling: Production code profiler that identifies inefficient methods and functions without impacting performance
- 500+ integrations: Pre-built dashboards and metric collection for AWS, Azure, GCP, Kubernetes, Postgres, Redis, NGINX, Kafka, and hundreds more
Datadog Use Cases
- Multi-cloud and hybrid environments: Single pane of glass across AWS, Azure, GCP, and on-premise
- Microservices and Kubernetes: End-to-end distributed tracing across containerized services
- SRE and DevOps teams: Incident management, SLO tracking, and on-call alerting
- Security operations: Threat detection and compliance monitoring across cloud infrastructure
- Enterprise-scale observability: Large organizations requiring deep correlation between metrics, logs, and traces
| Expert Tip Datadog’s power is in correlation — connecting a spike in latency (metrics) to a specific code path (APM trace) to the exact error logs that caused it. If your team spends hours debugging incidents across separate tools, that correlation capability alone can justify the cost. |
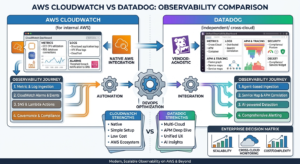
AWS CloudWatch vs Datadog: Head-to-Head on What Matters Most
1. Infrastructure Monitoring
CloudWatch automatically collects metrics from all AWS services — no agent required. EC2 provides basic monitoring (5-minute intervals) by default, with detailed monitoring (1-minute intervals) available for an additional cost. For AWS resources, this seamless coverage is hard to beat.
Datadog requires the Datadog Agent to be installed on monitored hosts. However, once deployed, it provides significantly richer infrastructure data — system-level metrics at 15-second intervals, process-level visibility, live container maps, and cross-cloud correlation that CloudWatch cannot provide.
- Log Management
CloudWatch Logs provides centralized log storage for AWS services and custom application logs. CloudWatch Logs Insights offers a SQL-like query language for log analysis, and you can create metric filters to generate custom metrics from log data. For basic AWS log aggregation, it works well.
Where CloudWatch Logs struggles is at scale and flexibility. Complex queries become expensive and slow. Log retention configuration is manual per log group. There is no built-in log anomaly detection without additional configuration.
Datadog’s Log Management platform offers real-time log ingestion with automatic parsing, pattern detection, anomaly alerts, and direct correlation with APM traces and infrastructure metrics. The live tail and faceted search experience is significantly more developer-friendly than CloudWatch Logs Insights. Log rehydration from archive is also available for cost management on high-volume log environments.
| Verdict: Log Management Datadog leads on log analysis experience, correlation capabilities, and scale. CloudWatch Logs is sufficient for basic AWS log aggregation but shows limitations in large-volume or complex query scenarios. |
3. Application Performance Monitoring (APM)
CloudWatch does not offer native APM in the traditional sense. AWS X-Ray provides distributed tracing for AWS-native applications, and CloudWatch ServiceLens integrates X-Ray traces with CloudWatch metrics and logs. For AWS Lambda and API Gateway, this coverage is reasonable. For complex microservices architectures, it is limited.
Datadog APM is one of the most mature distributed tracing solutions available. It supports automatic instrumentation for Java, Python, Node.js, Go, Ruby, .NET, and PHP. It generates service maps automatically, surfaces latency percentiles (p50, p95, p99), identifies downstream service dependencies, and correlates traces directly with logs and infrastructure metrics — all in a single interface.
- Alerting and Incident Management
CloudWatch Alarms support threshold-based and anomaly detection alerting. Alarms can trigger SNS notifications, auto-scaling policies, Lambda functions, or Systems Manager actions. Composite alarms allow combining multiple conditions. For AWS infrastructure events, this is well-integrated and reliable.
Datadog Monitors provide a broader alerting framework with anomaly detection, outlier detection, forecast alerts, and SLO-based alerts. Datadog also integrates with PagerDuty, OpsGenie, Slack, and incident management platforms natively. The alert notification experience and on-call routing capabilities are more mature than CloudWatch alone.
- Ease of Use and Onboarding
CloudWatch requires minimal onboarding for AWS users — it is already there. The challenge is in configuration: creating useful dashboards, setting meaningful alarms, and writing efficient Logs Insights queries all have learning curves. The CloudWatch console is functional but less intuitive than dedicated observability platforms.
Datadog has a steeper initial onboarding cost — installing agents, configuring integrations, and setting up dashboards takes time. However, once deployed, Datadog’s out-of-the-box dashboards, auto-detection of services, and guided setup workflows deliver a more polished day-to-day experience for engineering teams.
| Verdict: Ease of Use CloudWatch wins on zero-configuration start for AWS environments. Datadog wins on long-term usability, dashboard quality, and developer experience once deployed. |
6. Multi-Cloud and Hybrid Support
This is the sharpest dividing line between the two platforms. CloudWatch is AWS-only. It does not monitor Azure, GCP, on-premise servers, or third-party services. If your stack includes anything outside of AWS, CloudWatch cannot cover it.
Datadog was designed from the start for heterogeneous environments. It supports monitoring across AWS, Azure, GCP, Kubernetes on any cloud or on-premise, and hundreds of third-party services. For organizations running multi-cloud or hybrid architectures, Datadog is the clear operational choice.
7. Pricing
CloudWatch pricing is usage-based and can appear low initially but scale unexpectedly with high data volumes. Key cost components include:
- Custom metrics: First 10,000 metrics at $0.30/metric/month
- Detailed EC2 monitoring: $2.10/instance/month (assuming 7 metrics per instance)
- CloudWatch Logs ingestion: $0.50/GB
- CloudWatch Logs storage: $0.03/GB/month
- CloudWatch Logs Insights queries: $0.005/GB scanned
- Dashboards: $3.00/dashboard/month (first 3 dashboards free)
Datadog pricing is host-based and product-tiered. Cost scales with the number of monitored hosts and which products you enable:
- Infrastructure Monitoring: Starting at approximately $15/host/month (Pro), $23/host/month (Enterprise)
- APM: Starting at approximately $31/host/month (Pro) for APM + Infrastructure
- Log Management: $0.10/GB ingested + $0.10/GB indexed (7-day retention)
- Synthetics, RUM, Security Monitoring: Separately priced add-ons
In practice: A small team running 10 EC2 instances with CloudWatch detailed monitoring, logs ingestion at 50GB/month, and a few custom metrics will pay roughly $60-$100/month. The same 10 hosts on Datadog Pro with APM would cost approximately $310-$460/month, not including log indexing.
At larger scale, Datadog’s host-based pricing can become very significant. Organizations running hundreds of hosts frequently find CloudWatch supplemented with custom tooling is substantially cheaper than full Datadog coverage.
| Verdict: Pricing CloudWatch is significantly cheaper for pure AWS environments, especially at scale. Datadog’s pricing reflects the breadth of its platform but can be a meaningful line item for growing teams. Always model your specific host count and product usage before committing. |
AWS CloudWatch vs Datadog: Full Feature Comparison Table
| Feature / Dimension | AWS CloudWatch | Datadog | Winner |
| Platform Type | Native AWS service | Third-party SaaS | Depends on stack |
| Infrastructure Monitoring | Auto for 70+ AWS services | Agent-based, any cloud or on-prem | Tie / Datadog for depth |
| Log Management | CloudWatch Logs + Logs Insights | Centralized, real-time, correlated | Datadog |
| APM / Distributed Tracing | AWS X-Ray + ServiceLens | Full APM with auto-instrumentation | Datadog |
| Alerting | Threshold + anomaly alarms | Monitors, SLO alerts, composite alerts | Datadog |
| Multi-Cloud Support | AWS only | AWS, Azure, GCP, on-prem, 500+ integrations | Datadog |
| Security Monitoring | Via GuardDuty / Security Hub (separate) | Built-in CSPM + threat detection | Datadog |
| Real User Monitoring | Available via CloudWatch RUM | Full RUM with session replay | Datadog |
| Synthetic Monitoring | CloudWatch Synthetics (canaries) | Browser + API tests, global locations | Datadog |
| Container Monitoring | Container Insights (ECS/EKS) | Deep Kubernetes + container support | Datadog |
| Pricing Model | Usage-based (per metric/GB/alarm) | Host-based + per-product | CloudWatch for AWS-only |
| Ease of Setup | Zero config for AWS services | Agent install + integration config | CloudWatch |
| Developer Experience | Functional, AWS console-based | Polished UI, rich visualizations | Datadog |
| Vendor Lock-in Risk | Locked to AWS ecosystem | Vendor lock-in to Datadog | Both carry lock-in risk |
| Free Tier | Yes — basic metrics and logs included | 14-day trial only | CloudWatch |
When to Choose AWS CloudWatch
CloudWatch is the right primary monitoring solution in specific, well-defined scenarios. It is not the right tool for every team — but for the right team, it is extremely cost-effective and deeply capable.
CloudWatch is the Best Fit When:
- Your entire infrastructure runs on AWS: EC2, Lambda, RDS, ECS, EKS, S3, API Gateway — no multi-cloud or on-premise components
- Budget efficiency is a priority: For AWS-native environments, CloudWatch provides strong coverage at a fraction of the cost of a commercial observability platform
- You need tight AWS service integration: CloudWatch integrates directly with Auto Scaling, CloudFormation, EventBridge, Systems Manager, and other AWS operational services in ways third-party tools cannot replicate
- Your monitoring needs are straightforward: Infrastructure metrics, log aggregation, and alarm-based notifications cover your requirements without needing advanced APM or deep distributed tracing
- You are AWS-certified or AWS-focused: Teams with AWS expertise will find CloudWatch easier to configure and maintain within familiar AWS tooling
- You are a startup in the AWS Activate or Free Tier ecosystem: CloudWatch’s included free tier and AWS-funded credits make it the obvious starting point
When to Choose Datadog
Datadog is the stronger choice when your observability requirements outgrow what CloudWatch can provide — either due to architectural complexity, multi-cloud scope, or the need for deeper correlation and analysis capabilities.
Datadog is the Best Fit When:
- You operate a multi-cloud or hybrid environment: Any combination of AWS + Azure, AWS + GCP, AWS + on-premise, or all of the above
- You need full-stack APM: Distributed tracing across microservices, especially with polyglot environments where services are written in different languages
- Your team is focused on SRE practices: SLO tracking, error budget management, sophisticated incident workflows, and on-call integration are native capabilities
- You have Kubernetes at scale: Datadog’s Kubernetes monitoring depth — cluster maps, pod-level visibility, HPA analysis, cost attribution — exceeds CloudWatch Container Insights
- Log correlation with traces and metrics is critical: The ability to click from a spike in your APM to the exact log line that caused it, in one platform, saves significant incident resolution time
- Security monitoring is a priority: Datadog CSPM and threat detection provide unified security visibility across cloud environments in a way CloudWatch + GuardDuty + Security Hub alone cannot match
- Your engineering organization is scaling rapidly: Datadog’s onboarding, out-of-the-box dashboards, and centralized observability reduce the coordination overhead of managing separate monitoring tools per team
The Hybrid Approach: Using CloudWatch and Datadog Together
Many mature engineering organizations do not choose one or the other — they use both strategically. This is a legitimate and common architecture in enterprise AWS environments.
A typical hybrid configuration:
- CloudWatch handles AWS service metrics, VPC Flow Logs, CloudTrail audit logs, and Auto Scaling triggers — tasks it performs natively and cost-effectively
- Datadog handles application-level APM, business metrics, cross-service tracing, and monitoring for non-AWS components including Kubernetes and third-party services
- Datadog’s AWS integration pulls CloudWatch metrics directly into Datadog dashboards — you get unified visibility without duplicating data collection
This approach avoids paying Datadog’s per-host pricing for monitoring AWS service metrics that CloudWatch already captures, while still gaining Datadog’s APM and log correlation capabilities where they add the most value.
The Datadog-CloudWatch integration is well-documented and officially supported by both AWS and Datadog. It allows metric forwarding from CloudWatch to Datadog without requiring the Datadog Agent on AWS-managed services like Lambda or RDS.
Conclusion: Making the Right Monitoring Decision
The AWS CloudWatch vs Datadog decision is not about which tool is objectively better — it is about which tool fits your architecture, team, and budget at your current stage.
Key takeaways:
- CloudWatch is the right foundation for AWS-native environments — zero configuration, deep AWS integration, and competitive cost for teams that live entirely within the AWS ecosystem
- Datadog is the right choice for multi-cloud, hybrid, or complex microservices environments where unified observability across all components, full APM, and developer experience justify the cost
- Many organizations benefit from running both — CloudWatch for AWS service-level monitoring and Datadog for APM, log correlation, and non-AWS components
- Cost modeling matters before committing — especially with Datadog’s host-based pricing, which scales significantly with infrastructure size
- Neither platform completely eliminates lock-in risk — build your observability strategy around open standards like OpenTelemetry where possible to maintain flexibility
Whether you are a startup optimizing your AWS costs, an SRE team building a mature observability practice, or an enterprise architect designing monitoring for a multi-cloud environment, the monitoring decision you make today will shape your operational capability for years.
Start with the tool that fits your current stack. Revisit when you outgrow it. And instrument everything from the start.