

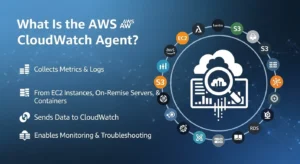
The AWS CloudWatch Agent is not “just a log shipper.” It’s the component that turns hypervisor-level visibility into in-guest observability across EC2, on‑prem servers, and even some containerized workloads—collecting met
rics, logs, and (in newer versions) traces. Without it, you can’t natively see memory pressure, swap saturation, or many host-level signals that cause real outages. AWS describes the CloudWatch agent as a software component that collects metrics, logs, and traces from EC2 instances, on‑prem servers, and containerized applications.
What Amazon CloudWatch Native Monitoring Can’t See — And Why That Gap Is Critical
The Default EC2 Monitoring Blind Spots :
What EC2 sends by default to CloudWatch (AWS/EC2): metrics such as CPUUtilization, NetworkIn/Out, DiskReadOps/DiskWriteOps, DiskReadBytes/DiskWriteBytes, plus status checks and other categories (credits, EBS checks on Nitro, etc.).
Default cadence matters:
- Basic monitoring: data points are 5-minute intervals by default.
- Detailed monitoring (optional): data points can be 1-minute intervals.
What that default view still cannot see (core in-guest gaps):
- RAM utilization and reclaim behavior (page cache vs “true” pressure)
- Swap usage trends
- Disk capacity used% per mount (vs only disk I/O counters)
- Process-level state and saturation signals
- Your application logs (unless shipped separately)
- Application custom metrics (queue depth, request rate, error counters)
Why this matters operationally: an instance can look “fine” on CPU and Network while being one GC cycle away from OOM kills or disk-full incidents. The CloudWatch Agent closes that gap by collecting in-guest system metrics, logs, and custom metrics via StatsD/collectd, which AWS lists as core agent capabilities.
The CloudWatch Agent’s Role in the AWS Observability Stack :
At a high level, the CloudWatch Agent sits between your hosts and CloudWatch telemetry services:
Host / VM / node → CloudWatch Agent → CloudWatch Metrics (namespace often CWAgent) + CloudWatch Logs → Dashboards, Alarms, Logs Insights
AWS notes:
- Metrics collected by the agent are published to CloudWatch (default namespace CWAgent unless you change it) and are billed as custom metrics.
- Logs collected by the agent go to CloudWatch Logs, same as the older Logs agent.
- The agent can also collect traces from OpenTelemetry or X-Ray SDKs (newer versions) and send them to AWS X-Ray, reducing the number of separate telemetry daemons.
CloudWatch Agent Architecture — How It Works Under the Hood
Agent Components and Data Collection Pipeline :
Think of the agent as a local telemetry pipeline with three main “inputs”:
- In-guest system collectors (CPU, memory, disk, network, processes, swap)
- Log tailers (file-based logs; Windows Event Log support via configuration)
- Custom metric receivers
AWS explicitly documents StatsD and collectd as supported protocols for retrieving custom metrics via the agent.
Visual reference (CloudWatch Agent + collectd)
Image : AWS blog “Getting Started with CloudWatch agent and collectd” (image search result)
Configuration File Structure — The JSON Schema Every Engineer Must Understand :
AWS defines the CloudWatch agent config as a JSON file with four sections:
Two fields are especially important at scale:
- append_dimensions: add EC2 dimensions (like InstanceId, AutoScalingGroupName) or custom key/value pairs to metrics. AWS notes this also changes default dimension behavior (hostname dimension).
- aggregation_dimensions: roll up metrics across one or more dimensions (e.g., aggregate all instances by AutoScalingGroupName). AWS explicitly frames this as a way to view fleet metrics “as a whole.”
Practical interpretation for infra Engineers :
- append_dimensions improves debugging (“which instance is sick?”).
- aggregation_dimensions improves cost and signal management (“do I really need per-instance high-cardinality metrics everywhere?”).
Metrics You Can Collect (What the Agent Actually Unlocks)
AWS lists a broad set of metric categories the agent can collect—covering CPU usage/time, disk free/used/used%, disk I/O, memory (including used percent), network, netstat, processes, and swap.
From an operations standpoint, the “big wins” are:
- Memory metrics (e.g., mem_used_percent)
- Disk used percent per mount (disk_used_percent)
- Swap used percent (swap_used_percent)
- Process state signals (processes_*)
Standard vs High-Resolution Metrics — The Real Tradeoff :
CloudWatch defines metric resolution as:
Important nuance for cost governance:
- CloudWatch charges you primarily based on how many unique custom metrics you publish (unique metric name + dimension set), not strictly the interval itself. The pricing page’s examples show $0.30 per custom metric (first 10,000), then tiered pricing at scale.
So the “high-resolution decision” is less about the per-metric monthly line item and more about:
- ingestion volume and API activity patterns (especially if you publish lots of distinct time series)
- alarm evaluation frequency and operational overhead
- cardinality explosion if you combine 1-second resolution with high-cardinality dimensions
Installation and Fleet Deployment — From Single Instance to 10,000 Nodes :
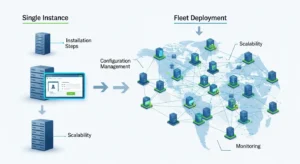
Method 1 — Single Instance Installation (for learning + validation)
AWS’s install guide supports manual installation via command line and also integration with Systems Manager.
Best practice: use manual install only to validate config and permissions. Your production pattern for fleets should be SSM.
IAM: The Permissions Reality You Must Plan For :
AWS’s docs emphasize creating IAM roles/users enabling the agent to collect/publish and optionally integrate with Systems Manager.
At minimum, your instances (or on-prem identity) must be able to:
- publish metrics to CloudWatch (custom metrics)
- write to CloudWatch Logs if you ship logs
- read config from Parameter Store if you centralize config via SSM
(Keep “least privilege” as a hard requirement; treat managed policies as a starting point, not an endpoint.)
Method 2 — SSM Fleet Deployment for 100+ Instances (Production Pattern)
AWS explicitly states that using AWS Systems Manager makes it easier to install the agent on a fleet: you can set it up on one server, store the config in Parameter Store, and then use SSM to install/configure the rest.
AWS’s documented building blocks include:
- Parameter Store for the shared configuration
- Run Command
- SSM documents:
Method 3 — Container Environments (ECS/EKS): Use the Purpose-Built Path
For container-heavy environments, you typically don’t treat the CloudWatch Agent like a classic per-VM host agent and call it done. Instead, you usually adopt Container Insights patterns (often with Fluent Bit / OpenTelemetry collector patterns depending on architecture).
Custom Metrics and Application Observability — Beyond System Metrics
Emitting Custom Application Metrics via StatsD :
AWS supports collecting custom metrics via StatsD. To enable it, you add a “statsd”: {} entry under metrics_collected in the agent config.
Key implementation details AWS provides:
- Default listener address is :8125 (UDP) via service_address (default :8125).
- StatsD types supported include counters, gauges, timers, histograms, sets.
Engineering advice: StatsD is ideal for “cheap instrumentation” in legacy apps where you want quick wins without heavy APM rollout.
collectd integration (Linux-only) for existing estates
AWS also supports collectd as an input protocol. collectd runs as the client; the CloudWatch agent acts as the server receiving metrics. AWS notes collectd is supported only on Linux servers.
To enable, add “collectd”: {} under metrics_collected.
Troubleshooting the CloudWatch Agent — The Fast Triage Model
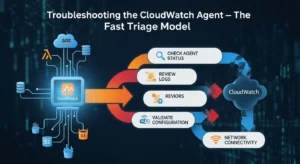
When “no metrics appear,” your root causes are usually one of:
- identity/permissions, 2) config parsing, 3) connectivity/region mismatch, 4) dimension/cardinality confusion, 5) fleet drift.
AWS’s installation doc lays out the overall flow (IAM → download → config → start). If you skip or partially implement IAM/config, you’ll fail silently until you check logs.
Use this mindset: verify the pipeline step-by-step:
- agent service is running
- agent log shows successful publish attempts
- metrics exist in CWAgent namespace (or your chosen namespace)
- the dimension set you’re filtering on matches what you’re actually publishing
CloudWatch Agent vs Third-Party Agents — The Decision Frame
Use CloudWatch Agent when:
- you want AWS-native telemetry staying in your AWS account
- you already standardize on CloudWatch dashboards/alarms/logs
- you want a first-party path for EC2 + hybrid servers
- you want SSM-based fleet management
AWS positions the agent as a unified collector across EC2, on-prem, and containerized apps, with StatsD/collectd inputs and the option to send metrics to CloudWatch and/or Amazon Managed Service for Prometheus.
Consider third-party when:
- you need deep APM + infra + logs correlation in one UI across multi-cloud
- you prefer open- Prometheus patterns end-to-end
- you want advanced out-of-the-box integrations (DBs, message queues, service meshes)
(But be explicit: you’re trading AWS-native governance for SaaS data-plane and licensing complexity.)
Cost Governance for CloudWatch Agent Deployments at Scale
Understand what drives your CloudWatch bill
AWS states:
- Agent metrics are billed as custom metrics.
- CloudWatch pricing examples show $0.30 per custom metric (first 10,000), with tiered pricing at scale.
- CloudWatch Logs ingestion and archival/storage pricing appears in the pricing examples (e.g., ingestion at $0.50/GB beyond free tier thresholds; archival at $0.03/GB in example scenarios).
Fleet-scale cost control tactics (battle-tested)
- Reduce cardinality first
- Don’t blindly publish per-instance + per-process + per-path dimensions everywhere.
- Use aggregation_dimensions intentionally
- AWS describes it as rolling up metrics (e.g., by AutoScalingGroupName) so you can see metrics “as a whole.”
- Ship fewer logs, keep fewer logs
- Log ingestion dominates bills in noisy environments. Use filters, structure logs, and retention policies aggressively.
- Monthly metric audits
- Treat metrics as an inventory. If a metric doesn’t back an alarm, SLO, dashboard, or investigation workflow, it’s usually waste.
FAQ
Q1: What is the AWS CloudWatch Agent?
AWS describes the CloudWatch agent as a software component that collects metrics, logs, and traces from EC2 instances, on-premises servers, and containerized applications.
Q2: Do I need the CloudWatch Agent if I already use CloudWatch?
If you need in-guest metrics (memory, disk used%, swap, processes) and log collection, yes—the agent is the native way to collect and publish those signals as custom metrics and CloudWatch Logs data. AWS lists these as key functions of the agent.
Q3: How do I deploy it across hundreds of instances?
AWS recommends using Systems Manager: create one configuration, store it in Parameter Store, and then use SSM documents such as AWS-ConfigureAWSPackage (install) and AmazonCloudWatch-ManageAgent (configure/start) across the fleet.
Q4: What’s the default StatsD port for the agent?
AWS documents the default StatsD service_address as :8125 (UDP).
Q5: What does it cost?
The agent software is free, but metrics are billed as custom metrics and logs are billed under CloudWatch Logs pricing. AWS’s pricing examples show custom metrics at $0.30 per metric (first 10,000) with tiered discounts, and include log ingestion/storage example pricing.
Conclusion :
The AWS CloudWatch Agent is a critical component for achieving full observability across EC2 instances, on-premises servers, and containerized workloads. While default CloudWatch metrics provide a high-level view, the agent unlocks in-guest visibility into memory, disk, swap, processes, and custom application metrics—allowing teams to detect issues before they become outages.
Proper deployment at scale, ideally via AWS Systems Manager, ensures consistent configuration across hundreds or thousands of instances, while features like StatsD and collectd support flexible custom metrics collection. Coupled with thoughtful cost governance—using aggregation, dimension management, and log retention policies—GoCloud helps organizations leverage the CloudWatch Agent to gain actionable insights without unexpected expense, ensuring reliable, optimized, and well-governed AWS environments.